syifbhuiyan
Tableau Project – Customer Personality Analysis
Goal: Analyze customer demographics, spending behavior, and campaign response to uncover insights that can inform marketing strategies.
Tools Used: Tableau, Excel
📝 Dataset Overview
- Source: Kaggle – Customer Personality Analysis
- Records: ~2,210 customers
- Columns include:
- Demographics: Age, Marital Status, Education, Income
- Spending: Amount spent on wine, meat, fruits, fish, etc.
- Campaigns: Response to 5 previous campaigns and one final campaign
- Others: Number of children, Recency (days since last purchase)
📊 Analysis Questions
- Which customer segments spend the most?
- How does income level affect spending patterns?
- What demographics respond best to marketing campaigns?
- What is the relationship between age and product preferences?
🔧 Data Cleaning Steps
- Created
Age= 2024 -Year_Birth - Created
Age_category=IF(C2<21, “1-20”, IF(C2<41, “21-40”, IF(C2<61, “41-60”, IF(C2<81, “61-80”, IF(C2<101, “81-100”, “100+”))))) - Created
Total_Children=Kidhome+Teenhome - Created
Total_Spend= sum of allMntcolumns - Created
Campaign_Response_Total= sum ofAcceptedCmp1toAcceptedCmp5&Response - Cleaned nulls in
Income
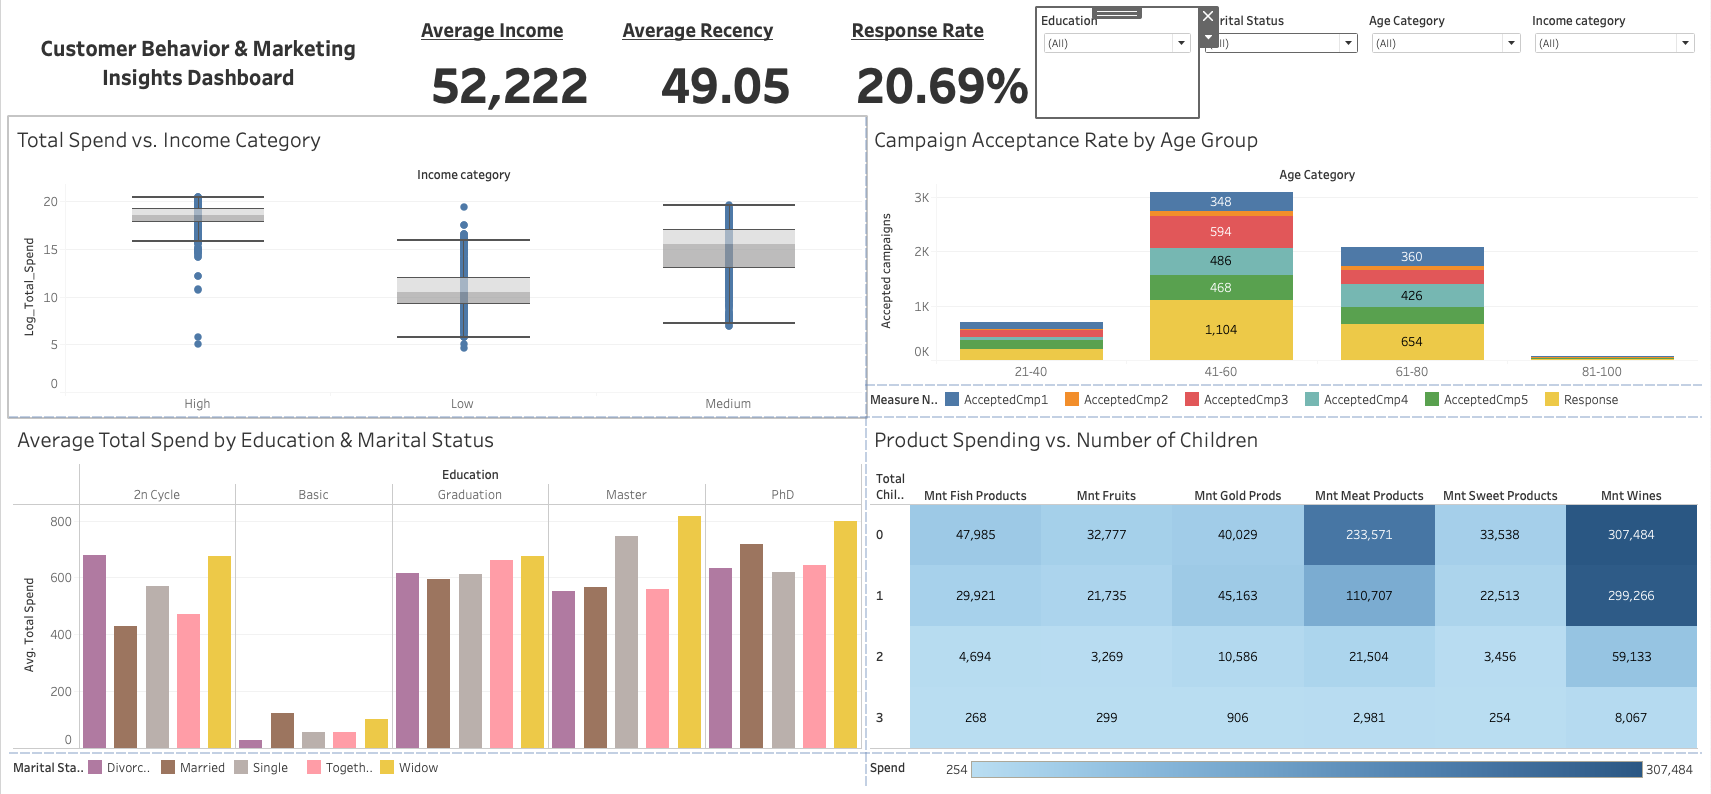
📈 Visualizations Created
| Viz Type | Description |
|---|---|
| Bar Chart | Avg spend by education level |
| Box Plot | Income vs Total Spend |
| Heatmap | Response rate by Age and Income |
| Stacked Bar | Campaign acceptance by marital status |
| KPI Cards | Avg Income, Avg Recency, Response Rate |
| Filters | Age, Education, Marital Status |
🔍 Key Insights
- Customers aged 21–60 with high income are the top spenders.
- Married and educated individuals are more likely to accept marketing campaigns.
- Parents with children at home respond less to campaigns.
- Wine and meat are the top spending categories across all groups.
🖼️ Dashboard Preview